
Blog · statistics
What Is Statistics? Mean, Median, Spread and Probability
· AI Math Tutor Team
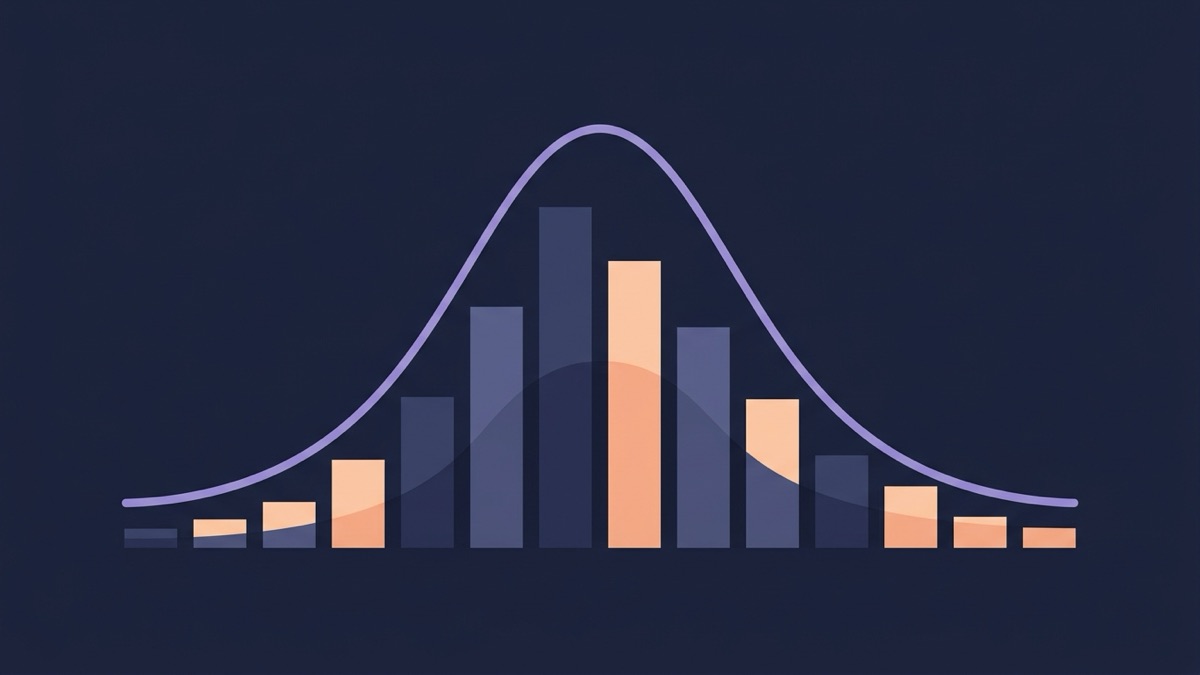
What is statistics? At its core, it is the study of collecting, describing, and drawing conclusions from data. That covers a wide range of tools, from a simple average to a full probability calculation, but nearly all of it builds on the same handful of ideas: where the center of the data sits, how spread out it is, and how likely a given outcome is. This post walks through those ideas in order, with a table for quick reference and three worked examples.
Key takeaways
- Descriptive statistics summarizes data you have; inferential statistics estimates something about data you do not fully have, based on a sample.
- Mean, median, and mode all describe the "center" of a data set, but they answer slightly different questions and react differently to extreme values.
- Range and standard deviation both describe spread; standard deviation is the more precise of the two because it uses every value, not just the two extremes.
- Probability describes how likely a single outcome is, on a scale from 0 (impossible) to 1 (certain).
- The right measure depends on the question you are asking and on whether the data has extreme values that could distort it.
Descriptive vs inferential statistics
Descriptive statistics describes the data sitting in front of you. If you have the test scores for every student in one class, calculating the class average, the highest score, and the lowest score is descriptive work: you are summarizing data you already fully have.
Inferential statistics goes a step further. It uses a sample, a smaller group measured from a larger population, to estimate something about the whole population without measuring every single member of it. Surveying 200 students out of a school of 2,000 and using their answers to estimate how the whole school feels about a topic is inferential statistics. The sample never captures the population perfectly, which is why inferential statistics also deals with uncertainty: how confident you can be in the estimate, and how far off it might be.
Most of an introductory statistics course, and most of what shows up in everyday reporting, like a poll result or an average, is a mix of both: descriptive tools to summarize what was measured, and inferential ideas to reason about what a smaller sample says about a bigger group. To see how sample data and population data differ in practice, see Population vs Sample in Statistics, With Examples.
Knowing which of the two you are doing changes how carefully you need to word a conclusion. A descriptive statement, like "the average score on this quiz was 83," is a plain fact about the data you measured. An inferential statement, like "students who use this study method tend to score higher," is a claim about a broader pattern, and it needs a large enough and fairly chosen sample before it means very much.
Measures of center: mean, median, and mode
The mean is the familiar average: add every value together, then divide by how many values there are. It uses every single data point, which makes it sensitive to extreme values. A single very high or very low number can pull the mean noticeably away from where most of the data actually sits.
The median is the middle value once the data is sorted from smallest to largest. If there is an even number of values, the median is the average of the two middle ones. Because the median only cares about position, not size, one extreme value barely affects it at all, which is why it is often reported instead of the mean for things like home prices.
The mode is the value that appears most often. A data set can have one mode, more than one mode, or no mode at all if every value is different. It is the only one of the three measures that also works on data that is not numeric, like the most common answer on a multiple-choice survey.
A quick way to decide between mean and median: picture the data sorted from smallest to largest and ask whether a small number of values sit far away from the rest. If a company's ten employees earn 40,000, 42,000, 45,000, 41,000, 43,000, 44,000, 46,000, 42,000, 45,000, and 400,000 dollars, the mean gets dragged upward by that one high earner, while the median stays close to what most employees actually make. Neither measure is "wrong," but they answer different questions, and picking the one that matches the question is the actual skill.
Measures of spread: range and standard deviation
Two data sets can share the exact same mean and still look completely different, which is what measures of spread are for. The range is the simplest: the highest value minus the lowest value. It is quick to compute but only looks at two of the values, ignoring everything in between.
Standard deviation is a more complete measure. It looks at how far every value sits from the mean, squares those distances (so negative and positive differences do not cancel out), averages the squared distances, and then takes the square root to bring the units back to match the original data. A small standard deviation means the data is clustered tightly around the mean; a large one means the values are spread out.
Here is the mean, stands for each individual value, and is the number of values. This version treats the data as the entire population being studied, which is the version covered in this post; a sample of a larger population uses a very similar formula with a small adjustment, covered in Statistics Review Sheet: Formulas and When to Use Them.
The squaring step in the middle of the formula matters more than it looks. Without it, a value 3 below the mean and a value 3 above the mean would cancel out to zero when averaged, making the data look perfectly consistent even though it is not. Squaring turns every distance positive first, so spread in either direction adds up instead of canceling.
Basic probability
Probability measures how likely a single outcome is, as a number between 0 and 1. An outcome with probability 0 never happens; one with probability 1 always happens. The basic formula for a simple event is
Rolling a standard six-sided die and asking for the probability of landing on a 4 has exactly one favorable outcome out of six possible ones, so . Probability connects directly back to statistics, because many statistical tools ask how likely it is that a pattern in your data happened by chance rather than for a real reason, a link the worked examples below build on directly.
A quick reference table
| Measure | What it tells you | When to use it |
|---|---|---|
| Mean | The overall average of the data | Data without extreme outliers |
| Median | The middle value once sorted | Data with a few extreme values |
| Mode | The most frequent value | Categorical or repeated data |
| Range | The gap between highest and lowest | A fast, rough sense of spread |
| Standard deviation | How far values typically sit from the mean | A precise measure of spread |
Keep this table nearby while you practice. The measure you should reach for almost always follows from the shape of the question: "typical value" points to mean or median, and "how spread out" points to range or standard deviation.
Worked examples
Example 1: find the mean and median
Five students scored 72, 85, 90, 90, and 78 on a quiz. Find the mean and the median.
- Add all five scores together to find the mean, since the mean uses every value.
- Divide the sum by the number of scores, 5.
- To find the median, sort the scores from smallest to largest and take the middle value.
So the mean is and the median is . Check the mean by re-adding the five original scores in a different order to confirm the sum of 415, and check the median by confirming there are exactly two scores below 85 and two above it in the sorted list.
Example 2: find the standard deviation
Find the population standard deviation of the data set 2, 4, 4, 4, 5, 5, 7, 9.
- Find the mean first, since standard deviation measures distance from the mean.
- Subtract the mean from each value and square the result.
- Average the squared differences to get the variance, then take the square root.
So the standard deviation is . Check it by confirming the squared differences sum to 32 and that 32 divided by 8 gives exactly 4 before taking the square root. This same data set, along with a matching z-score, is worked through again in Statistics Problems Solved Step by Step: Mean to Z-Scores.
Example 3: find a probability
A bag holds 5 red marbles and 3 blue marbles. Find the probability of drawing a red marble at random.
- Count the total number of marbles in the bag, since probability compares favorable outcomes to all possible outcomes.
- Divide the number of red marbles by the total number of marbles.
So the probability of drawing red is , or . Check it by finding the probability of the opposite event, drawing blue: , and , which is exactly what the two possibilities should add up to.
Common mistakes
- Using the mean on data with a big outlier, which pulls the average away from what most values actually look like, then reporting it as if it described a typical case.
- Forgetting to sort the data before finding the median, which gives a meaningless middle value that has nothing to do with the actual center of the data.
- Mixing up range and standard deviation, or reporting one when the question specifically asked for the other.
- Skipping the square root at the end of a standard deviation calculation and reporting the variance instead, which uses squared units and is not directly comparable to the original data.
- Writing a probability as a number bigger than 1 or smaller than 0, which is not possible for any real probability and usually signals a setup mistake.
- Treating a small sample as if it perfectly represents a much larger population, without acknowledging that a different sample could have given a somewhat different answer.
Statistics builds the same way every other math topic does: a small set of core ideas, applied carefully and checked at the end. For a step-by-step method that works on any kind of problem, not just statistics, see How to Solve Any Math Problem Step by Step. Scan your next statistics problem and read every step in AI Math Tutor.
AI Math Tutor is a study aid, not a substitute for a teacher, and it can make mistakes: check every step, not just the answer.
Questions
What is the difference between descriptive and inferential statistics?
Descriptive statistics summarizes the data you actually have, using numbers like the mean or the range. Inferential statistics uses a smaller sample of data to make a reasonable estimate about a larger group you did not fully measure. A class average is descriptive; guessing a whole school's average from one class is inferential.
When should you use the median instead of the mean?
Use the median when the data has an extreme value or two that would pull the mean away from what is typical. Household income and home prices are usually reported as medians for this reason, since a small number of very high values can drag the mean well above what most cases actually look like.
What does standard deviation actually measure?
Standard deviation measures how spread out the data is around the mean. A small standard deviation means most values sit close to the mean; a large one means the values are scattered further away. It uses the same units as the original data, which is what makes it easier to interpret than variance.
What is the difference between probability and statistics?
Probability starts from a known situation, like a fair six-sided die, and predicts how likely an outcome is. Statistics usually works the other way: it starts from data you already collected and tries to describe or draw conclusions from it. The two fields share a lot of the same math but ask different questions.